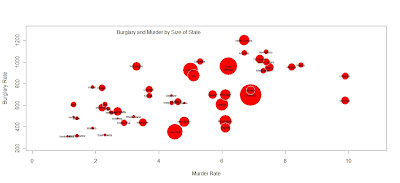
All it took was a few lines of code.
crime <- read.csv("http://datasets.flowingdata.com/crimeRatesByState2008.csv",header=TRUE, sep="\t")
symbols(crime$murder, crime$burglary, circles=crime$population)
radius <- sqrt ( crime$population/ pi )
symbols(crime$murder, crime$burglary, circles=radius, inches=0.35, fg="white", bg="red" , xlab="Murder Rate", ylab="Burglary Rate")
text(4,1275,"Burglary and Murder by Size of State")
text(crime$murder, crime$burglary, crime$state, cex=0.5)


No comments:
Post a Comment