
Thursday, 2 December 2010
How the BBC sexed up statistics
As has been noted here and here the Beeb has a new series out on statistics. Yes you read that correctly. OK we are talking BBC 4 here rather than prime time BBC 1 but still respect to the BBC for taking on a hard subject and as you can see from the video above making great television. Hopefully the rest of the programme which is out on Tuesday 9pm will be as good.
Sunday, 28 November 2010
Cluster Analysis

Cluster Analysis has been around for a few decades and uses a range of mathematical formula to categorise data into smaller groups or "clusters" which enable researchers to discover relationships. That sounds complex but thankfully computers do all the legwork and it can be a great form of exploratory data analysis with good data visualisation potential. R Tutor has a great tutorial. Here is the code.
> d <- dist(as.matrix(mtcars))
> hc <-hclust(d)
> plot(hc)
Yes that's it!
Saturday, 27 November 2010
The Edinburgh Edition
 This is my wildly optimistic training plan for next years Edinburgh Marathon. R good for plotting high weekly mileages; not so good for actually doing 20 mile training jogs but it's only a programming language. Speaking of which here is the code.
> jog <-c(24,27,30,34,38,42,44,46,34,48,50,52,34,54,60,65,34,70,60,40,34,15)
> barplot(jog,ylab="Miles", xlab="Week")
> title(xlab= "Week", col.lab=rgb(0,0.5,0))
> title(ylab= "Miles", col.lab=rgb(0,0.5,0))
> title(main="Edinburgh Marathon 2011 Training Plan",)
Tuesday, 23 November 2010
Crime data brought to you by R
Like Andy Cotgreave I have been inspired by this Flowingdata tutorial. Why not have a go yourself?
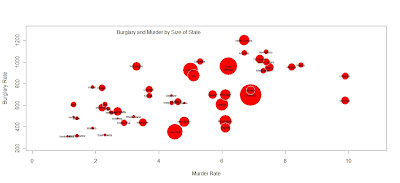
All it took was a few lines of code.

All it took was a few lines of code.
crime <- read.csv("http://datasets.flowingdata.com/crimeRatesByState2008.csv",header=TRUE, sep="\t")
symbols(crime$murder, crime$burglary, circles=crime$population)
radius <- sqrt ( crime$population/ pi )
symbols(crime$murder, crime$burglary, circles=radius, inches=0.35, fg="white", bg="red" , xlab="Murder Rate", ylab="Burglary Rate")
text(4,1275,"Burglary and Murder by Size of State")
text(crime$murder, crime$burglary, crime$state, cex=0.5)
Friday, 15 October 2010
Not on TV
Possibly the smartest, coolest and beautiful video you will see on the changing nature of information in the digital age.
Thursday, 14 October 2010

Tuesday, 6 July 2010
Levels of Measurement
The seminal paper that first set out levels of measurement was "On the theory of scales of measurement" by S.S. Stevens (1946) you can download a copy from here. He argues that all measurements have to fit one of his four levels of measurement, nominal, ordinal, interval or ratio. They can also be characterised more broadly into Categorical and Continuous
Categorical variables
These are variables that come in categories
- Nominal: Determination of equality. More than 2 categories in no particular order eg. Types of transport bicycle, car, train
- Binary: Data in only 2 categories eg. Pregnancy, pregnant or not pregnant
- Ordinal: Determination of greater or less. More than 2 categories with logical order eg. Social class A,B,C1,C2,D,E
Continuous
This are numerical variables.
- Interval, Determination of equality of intervals or differences. It is like an ordinal variable in that it is ranked but additionally it is a measurement where the difference between two values is meaningful. An example would be temperature in degrees Celsius
- Ratio, Determination of equality of ratios. Must be ranked like ordinal, like interval the difference must be meaningful but also there must be a non arbitrary absolute zero and have a ratio so that you can multiply and divide the data. In social research most "count" variables are ratio, for example, the number of sales in the past month. Why? Because you can have zero customers and because it is meaningful to say that "we had twice as many customers in the past month as we did in the previous month."
- Discrete variables uses whole numbers. A variable can be continuous and discrete or just continuous.
What type of measurement used effects the the type of statical analysis that should be used on the data. Nominal is the least statistically useful then ordinal and interval. Finally ratio is the most useful for doing analysis on.
Subscribe to:
Posts (Atom)

